Everyone has a rough idea of what “upper middle class” looks, feels, and sounds like. Nice neighborhood, solid career, a retirement account that isn’t completely embarrassing. But when it comes to the actual numbers, most people have no idea where they truly stand. And honestly, the answer might surprise you.
The lines between classes are blurring fast in 2026. Inflation, rising housing costs, and shifting income benchmarks mean that what felt like financial comfort just five years ago can now feel worryingly thin. So let’s get into the real data, state by state and dollar by dollar, and find out what it genuinely takes to wear the “upper middle class” label today. Let’s dive in.
The Income Range That Defines Upper Middle Class in 2026
Here’s the thing: there is no single magic number. The definition shifts depending on who you ask and where you live. That said, the most widely cited figures give us a solid starting point.
Based on current data, a household earning between roughly $117,000 and $150,000 would place you among upper-middle-class Americans in most cities around the country in 2026. That range accounts for the majority of typical U.S. metro areas.
A commonly cited range from Yahoo Finance puts the upper middle class between approximately $106,000 and $250,000 per year, while other sources define it as starting around $104,000 and reaching up to $153,000 in 2026, per CNBC. So the spread is real, and where you fall depends heavily on context.
In the U.S., the upper middle class typically includes professionals and households with incomes well above the national median, but below the top five percent. Think doctors, senior managers, engineers, and established small business owners, not hedge fund managers or tech billionaires.
The National Median Household Income: Your Starting Benchmark
Before figuring out if you’re upper middle class, you need to understand the baseline. Think of it like a race: you can’t know if you’re ahead unless you know where the starting line is.
Based on the most recent U.S. Census Bureau data and the Pew Research Center, the median household income is listed at $74,580. That’s the midpoint, meaning half of American households earn more and half earn less.
The accepted standard for defining America’s income tiers places them relative to the national median household income: lower-income citizens earn less than two-thirds of the median, middle income falls between two-thirds and double the median, and upper class is more than double. It’s a neat framework, even if it glosses over a lot of real-world complexity.
Using this standard, estimated middle income in 2026 falls between roughly $60,000 and $180,000 per year, with upper income beginning above $180,000. That makes the upper middle class something of a high-performing subset within the broader middle income band.
Why Your State Changes Everything

I think this is the part that shocks most people. You can have the exact same salary and be considered comfortably upper middle class in one state and barely scraping middle class in another. Geography rewrites the rulebook entirely.
You can earn over $200,000 and still be considered middle class in five states, and Massachusetts has the highest threshold to break out of the middle class, with the upper bounds at $209,656 per year. That’s a staggering number to still be “middle.”
A six-figure salary once signaled comfort, sometimes even abundance. Today, in many high-cost regions, it places you squarely in the middle, or even in the lower middle class once housing, childcare, groceries, and taxes are factored in. In contrast, the same salary may push a family toward upper-middle-class income in states where living costs are lower.
At the other extreme, Detroit has the lowest income range to be considered a middle-class household, at a lower entry point of $25,384, capping at $76,160. The contrast with Massachusetts is almost hard to believe. Same country, completely different financial universe.
The Net Worth Threshold: It’s Not Just About Income
Salary is one thing. Net worth is another animal entirely. And here is where the upper middle class truly separates itself from everyone else.
The upper middle class, also known as the mass affluent, is loosely defined as individuals with a net worth or investable assets between $500,000 and $2 million. That’s a wide band, sure, but it captures the core idea: serious wealth that isn’t yet generational-elite territory.
The middle class can be subdivided into lower-middle class and upper-middle class, with the upper-middle tier displaying a net worth often ranging from $500,000 to $700,000 or more. These families frequently have investable assets beyond their homes, established college funds for children, and could weather several months of unemployment without severe hardship.
The overall average net worth in the U.S. is $1.06 million, while the median is $192,700, according to the Federal Reserve, and net worth often grows with age, then drops in retirement. That average is dramatically skewed by the super-wealthy. Most Americans sit far below that $1 million figure.
What Upper Middle Class Savings Accounts Actually Look Like
Let’s be real. A lot of people who earn decent money are still running surprisingly thin bank accounts. Income and savings are not the same thing, and the numbers make that painfully clear.
The typical American household has $8,000 in their bank account, according to the latest data from the Federal Reserve’s Survey of Consumer Finances. That’s the median transaction account balance as of 2022, which includes savings, checking, money market, call accounts, and prepaid debit cards. The average balance in those bank accounts among American households is $62,410.
Federal data shows that on average, single individuals under 55 have $19,320 in savings, while single parents with children have an even lower balance of $16,800. In contrast, couples without children hold the most savings, averaging $103,140. Upper middle class households typically sit considerably above all of these averages.
Education level strongly correlates with bank account balance. The largest median balance jump occurs from those with some college ($5,200) to those with a bachelor’s degree ($23,700). Higher education is practically a prerequisite for accessing upper-middle-class financial territory in 2026.
Retirement Savings: The Real Wealth Indicator

Honestly, if you want to know whether someone is truly upper middle class, skip the car and look at the retirement account. That’s where the real differentiation happens.
Retirement assets accounted for roughly a third of all household financial assets in the U.S. at the end of June 2025, according to the Investment Company Institute, with total U.S. retirement assets reaching $45.8 trillion at that same point. The macro numbers are enormous, but that doesn’t mean individual accounts are well-stocked.
The average 401(k) retirement balance across all age groups is $144,400, according to Fidelity Investments’ Building Financial Futures Q3 2025 report. For true upper-middle-class status, that number needs to be substantially higher, especially the closer you get to retirement age.
T. Rowe Price analysis suggests that 45-year-olds should have three times their current income set aside for retirement, rising to five times at age 50 and seven times at age 55. For someone earning $120,000 annually at 55, that translates to $840,000 in retirement savings alone, not counting home equity or other assets. That’s a genuinely demanding target.
The “HENRY” Problem: High Earners, Low Net Worth

Here’s a fascinating wrinkle in the upper middle class story. There’s a whole category of people who technically earn upper-middle-class incomes but haven’t built upper-middle-class wealth. They even have a name.
Upper-middle-class households often have incomes in the top fifteen percent, roughly $140,000 or greater for families in 2025. They are known as “HENRYs,” or High Earners Not Rich Yet, indicating their potential for future wealth growth through disciplined savings and investments.
One financial framework spotlights the rapid rise and growing angst of what some analysts call “level 4”: the upper-middle-class person who is wealthy on paper but not in their feelings. UBS calls this the “everyday millionaire.” They earn a lot, spend a lot, and somehow still feel behind.
Inflation caused by the pandemic hit middle-class families hard, with incomes not keeping up with cost-of-living increases. Housing costs skyrocketed in many areas, mortgage interest rates rose to levels not seen since the pre-Obama era, and grocery bills increased significantly. The HENRY experience is partly a product of this economic squeeze at the top of the middle.
Homeownership and Its Role in Upper Middle Class Wealth

It’s almost cliche at this point, but home equity remains one of the most powerful wealth-building tools available to the upper middle class. The data backs this up decisively.
According to the Federal Reserve’s Survey of Consumer Finances, the typical U.S. homeowner has a median net worth of $396,200, compared with just $10,400 for the average renter. In other words, homeowners held nearly 38 times more wealth, showing how much long-term homeownership can shape financial stability. That’s not a small gap. That’s a financial chasm.
Homeownership for the upper middle class is a given, often in desirable neighborhoods with strong schools. Retirement accounts are well-funded, college savings plans are in place, and vacations aren’t just an occasional luxury. While debt may still exist, it’s manageable, with assets growing at a pace that ensures financial security.
The upper middle class, the top twenty percent of Americans, tend to have a net worth where their primary residence is worth less than thirty percent of their overall net worth. That’s the key distinction: their home is one asset, not their only asset. That diversification is what separates them from the merely house-rich.
Inflation Is Moving the Goalposts
Just when you think you’ve figured out where the line is, inflation shifts it. That’s the frustrating reality of trying to define upper middle class in a period of sustained economic pressure.
In 2026, it’s possible that the income range defining the upper middle class could shift upward due to inflation. The expected annual inflation rate has risen to 2.6%, while the core inflation rate, which excludes categories with high price fluctuation such as energy and food, is expected to rise to 2.8%, according to the Commerce Department’s Personal Consumption Expenditures Price Index.
What this means for the middle class is that daily living expenses will continue to rise, putting pressure on household budgets to maintain their standard of living. As a result, households will need to earn more in order to maintain or move up to upper-middle-class status. The treadmill keeps speeding up.
One government study found that the cost of living has increased between around $800 and $1,300 a month, depending on the state, since 2021, putting a squeeze on everyone, including the middle class. That kind of monthly drag is genuinely hard to outrun, even on a solid income.
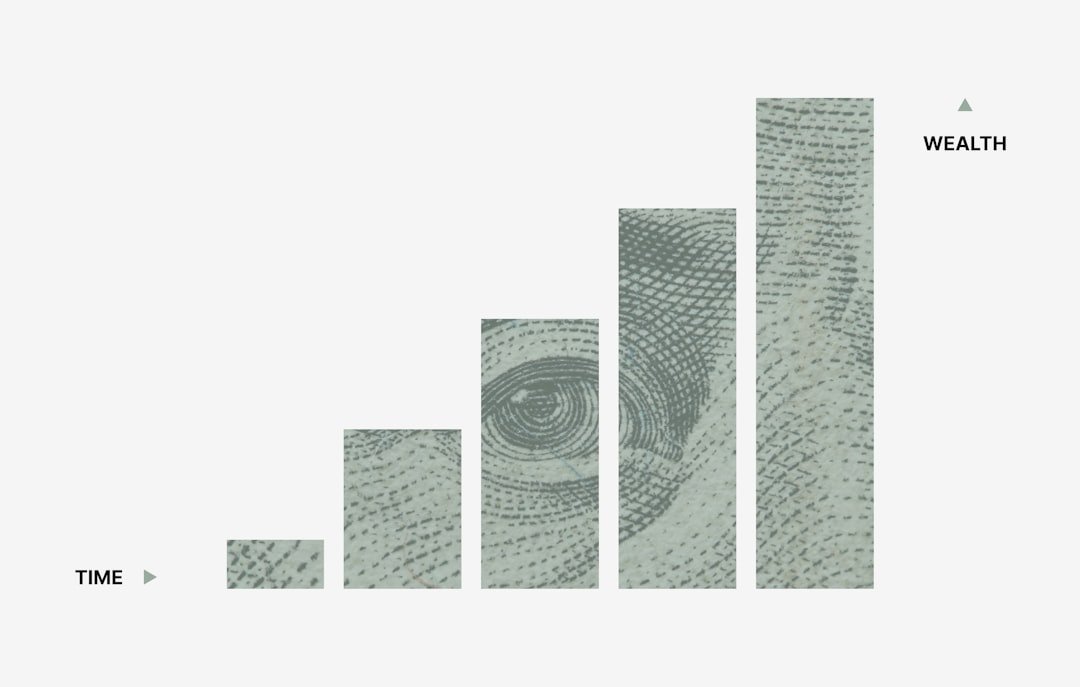
The Wealth Gap Between Classes Is Growing
This is not a comfortable section to end on, but the honest picture demands it. The distance between the upper middle class and everyone else is getting wider, and the data doesn’t sugarcoat it.
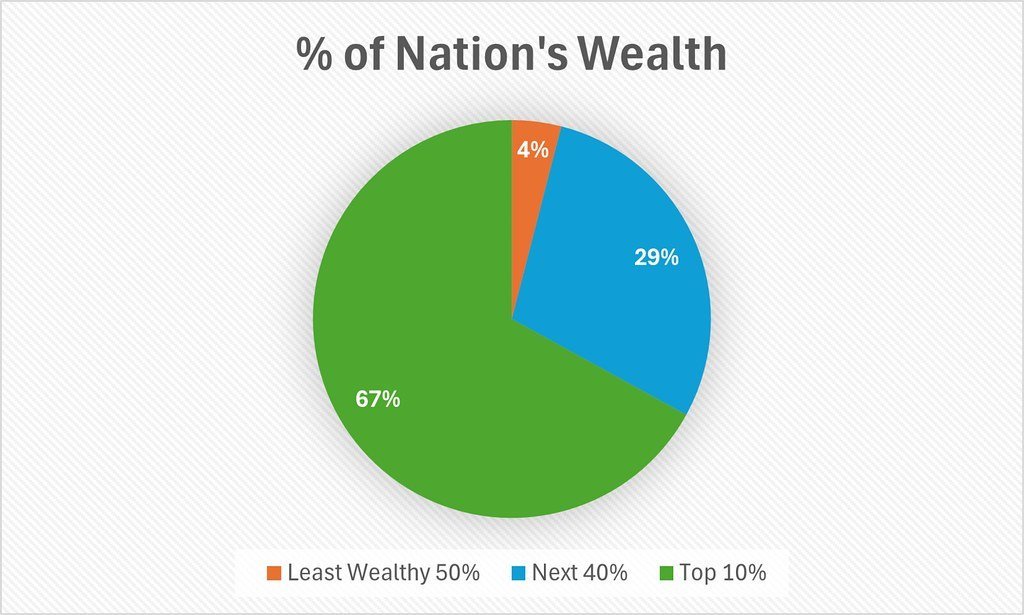
Despite representing about half the population, the middle class controls only about forty percent of the nation’s wealth. This class has also shrunk over time, from sixty-one percent of households in 1971 to approximately fifty-one percent today, as more families have shifted into either lower or upper income brackets.
The twenty-fifth percentile of American households holds about $29,300 in net worth, while the seventy-fifth percentile sits at roughly $714,000. The top ten percent of households require a net worth exceeding $2.1 million. That gap between the twenty-fifth and seventy-fifth percentile is striking on its own, but the distance to the top ten percent is something else entirely.
According to a study by the USC Schaeffer Center for Health Policy and Economics and the Columbia University Mailman School of Public Health, lower-middle-class Americans nearing retirement age are worse off than they were two decades ago and often struggle to pay for healthcare and housing. On the other hand, upper-middle-class Americans have seen their life expectancy and wealth improve. The divide isn’t just financial. It’s showing up in health outcomes too.
So what’s the real takeaway from all this data? Upper middle class in 2026 isn’t a fixed address on the financial map. It’s a moving target shaped by where you live, how old you are, whether you own a home, and whether your savings are working as hard as you are. The income range gives you a rough idea, but net worth, retirement savings, and investable assets tell the fuller story.
The question worth asking yourself isn’t just “do I make enough?” It’s “am I building enough?” What do you think? Does your bank balance match the class you thought you were in?