Picture yourself standing in a gas station checkout line in 1995, tossing a full-size candy bar onto the counter for somewhere around fifty cents. Now picture doing the same thing in 2026 and handing over nearly two dollars, sometimes more, for something that fits noticeably more snugly in your palm. Same wrapper. Same brand. Smaller everything else.
The candy bar has quietly become one of the most honest economic barometers in America. It tells a story that official inflation numbers only partly capture. That story involves shrinking grams, rising cocoa prices, political drama, and a phenomenon economists call shrinkflation. Buckle up, because what’s been happening to your chocolate since 1995 is genuinely eye-opening. Let’s dive in.
What Is Shrinkflation and Why Does a Candy Bar Explain It So Well?
Shrinkflation refers to companies reducing the size or quantity of products while keeping the same price point, raising the price per unit. It sounds almost harmless when you describe it clinically like that. But live it as a consumer and it feels like slow-motion theft.
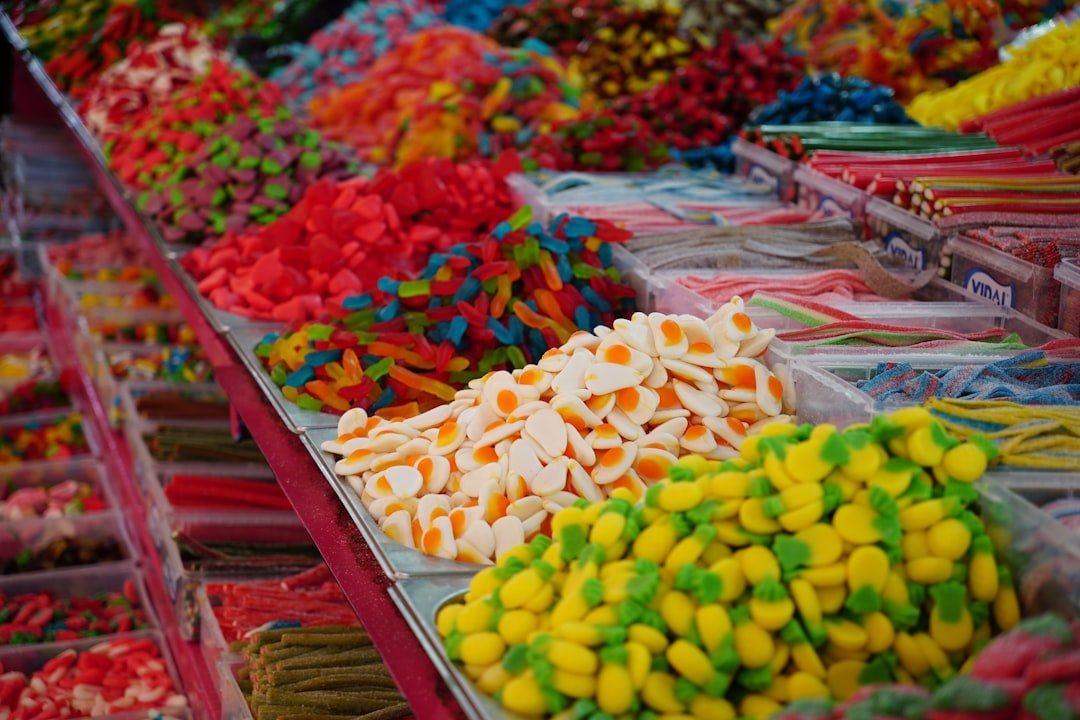
In economics, shrinkflation, also known as package downsizing, is the process of products shrinking in size or quantity while prices remain the same. The word itself is a portmanteau of “shrink” and “inflation,” coined as the counterpart to economic inflation, where prices rise while the product remains unchanged. The candy bar is the perfect vehicle for understanding this because it’s simple, universally purchased, and bought by people across all income levels.
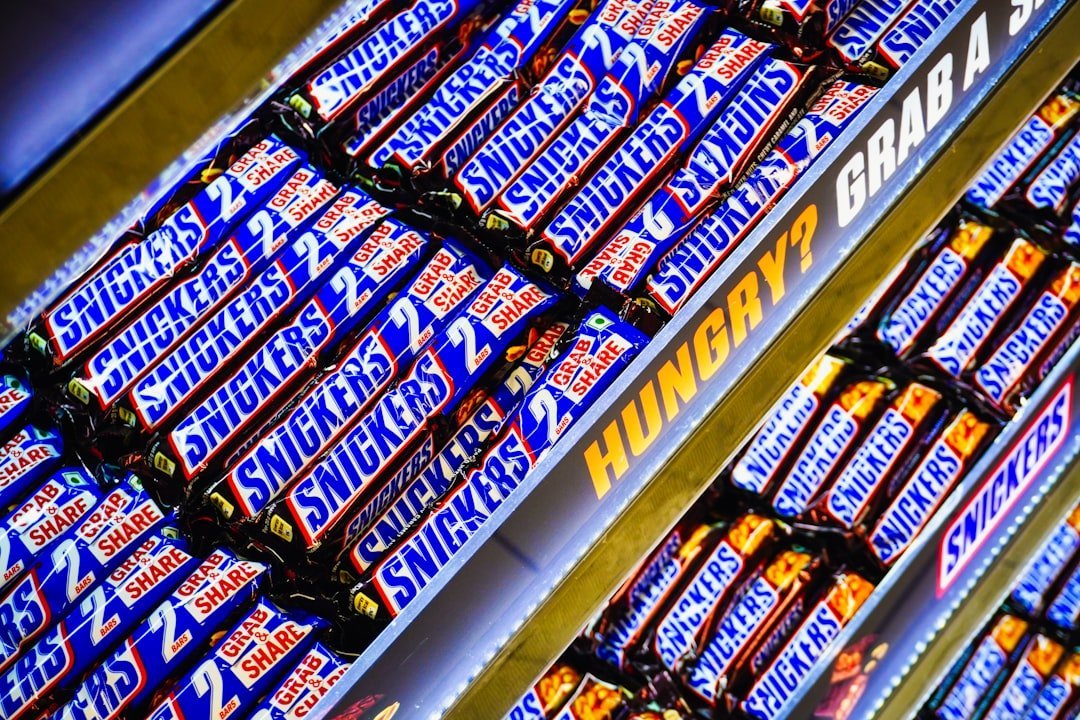
Food and beverage industries are the most likely to utilize shrinkflation during periods of high inflation. Think about it like this. If a bowl of soup quietly gets two spoonfuls smaller each year for ten years, you’ve eventually lost an entire serving without ever seeing a price tag change. That’s what happened to your Snickers.
A Dollar in 1995 Versus a Dollar Today: The Math Is Brutal
Here is where things get genuinely uncomfortable. Candy and chewing gum costing $20 in 1997 would cost $43.96 in 2026, according to U.S. Bureau of Labor Statistics Consumer Price Index data. Between 1997 and 2026, candy and chewing gum experienced an average inflation rate of 2.75% per year.
Compared to the overall inflation rate during this same period, inflation for candy and chewing gum was actually higher. That’s not a typo. Your candy bar inflated faster than the general economy. The years with the largest price changes in candy were 2023, with roughly 9.4% growth, 2022 at around 9.35%, and 2025 at around 6.95%.
In 1975, the average cost of a candy bar was only 20 cents. But in 2025 dollars, that 20 cents, adjusted for inflation, is equivalent to roughly $1.16 based on inflation calculator data – and it turns out the average cost of a candy bar in 2025 actually matches this inflation-adjusted figure. Surprisingly, on the price front alone, candy bars have more or less tracked inflation. The real crime is what happened to the size.
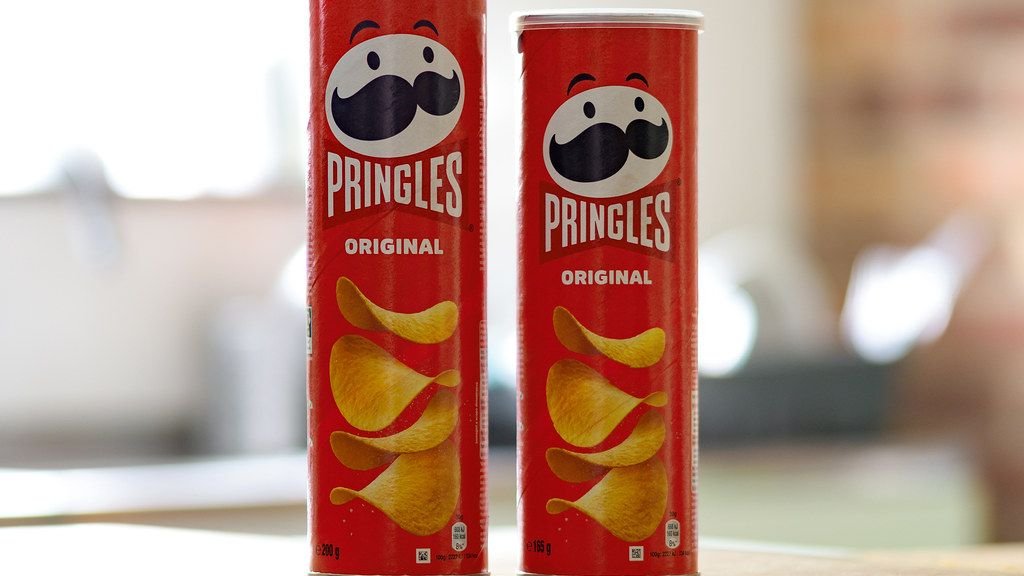
The Quiet Downsizing: How Much Smaller Have Bars Actually Gotten?

Many candy bars have quietly shrunk in size over the decades, a practice known as shrinkflation, to offset rising production costs without raising prices. The changes happen so gradually that most people don’t notice until they’re showing a vintage wrapper to a friend and going, “Wait, was it really that big?”
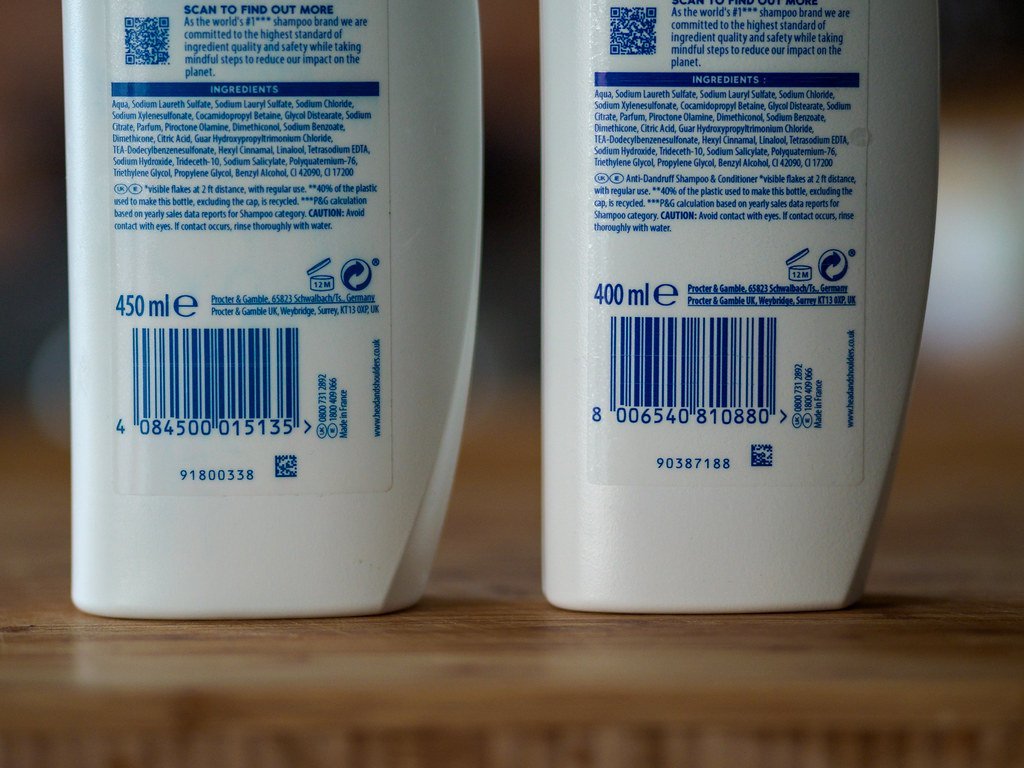
The UK Mars bar saw significant reductions over just a few years, dropping from 62.5 grams in 2008 to 58 grams and then to 51 grams by 2013. That’s a roughly 18% reduction in what you’re actually eating, all while the price held steady or crept upward. In the nineties, Mars bars were a staggering 65 grams. By 2009, they shed a whole 15 grams. A small one-gram bump in 2013 brought them back up to 51 grams, which is the same weight they hold today.
Data from CBC shows that Oh Henry bars, for example, shrank by 7.2% in one year alone, Coffee Crisp by 10%, M&Ms by 20%, Kit Kat by 2%, and Toblerone by 10%. Those aren’t rounding errors. Those are meaningful losses of product that most shoppers never noticed at the register.
The Manufacturer’s Playbook: Why Shrink Instead of Raising Price?
Let’s be real. If a company raised the sticker price of your candy bar by 15 cents overnight, you’d notice. You might even grumble at the cashier. But shaving off a few grams? Virtually invisible. A manufacturer may anticipate that a per-unit price increase will have less effect on sales than simply raising the price without changing the size. Studies have found that consumers were less likely to react to downsizing than to price increases.
Shrinkflation allows manufacturers and retailers to manage rising production costs while maintaining sales volume, operating margins, and profitability, and is often used as an alternative to raising prices in line with inflation. Essentially, companies are betting that you’re watching the price tag, not the weight listed in small print on the back.
Why candy bar size wavers up and down is based on another way to counteract inflation rates. Instead of going up on the price, a manufacturer can go down on size, making manufacturing costs cheaper by volume, so the bar costs the same to make without having to change sticker prices. It’s a well-worn trick. Honestly, it’s almost elegant in a cynical sort of way.
Confectionery Prices Rose Roughly Two-Thirds in Just Six Years
A fresh retail study found that confectionery in the US has risen by a total of 67% in the past six years, with issues continuing to increase including the introduction of tariffs, which have impacted store pricing. Let that sink in. Two-thirds more expensive in six years.
While prices have gone up roughly two-thirds since the pandemic began, average household Easter candy budgets have grown only about 15% over the same period. That gap between what things cost and what households can realistically spend is exactly why consumers feel squeezed even when they can’t articulate why. By 2025, some tracked candy prices had jumped to $8.29, surpassing all previous levels.
Research has revealed a pattern held across brands: steady, incremental changes that consumers absorbed without recognizing the total impact over time. It’s the classic boiling frog analogy. Each individual price bump or size reduction feels tolerable in isolation. Together, they represent a massive erosion of what your dollar can actually buy at a candy aisle.
The Cocoa Crisis: How a Crop Shortage Turbocharged Everything
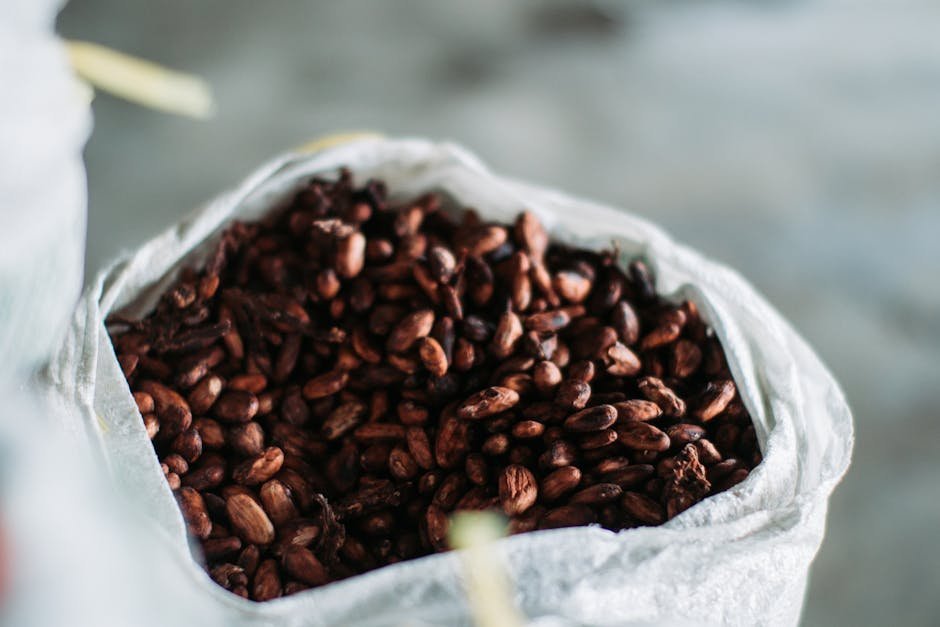
Here’s the thing that separates the candy bar story from most other shrinkflation stories. Chocolate has a unique and increasingly volatile raw ingredient at its core. For the last 25 years, the price of cocoa was fairly stable at around 2,000 to 3,000 GBP per metric ton. During the first half of 2024 and the start of 2025, however, the price quadrupled to over 8,000 GBP per metric ton. Even though it has since crashed back down, it still remains above historic levels at 4,000 GBP per metric ton.
Overall, 2024 saw historic highs for cocoa prices, which increased by more than 177%, following several factors including weather disruption from the El Niño phenomenon and dwindling volumes. That kind of commodity spike doesn’t stay invisible for long. It flows directly into manufacturing costs, then into the size or price of what ends up on shelves.
It is likely that consumers spent between 10% and 20% more for the same chocolate products in 2025 than they did in 2024, according to commodities analyst data from Wells Fargo’s Agri-Food Institute. Wholesale prices surged by 30% from January 2024 to January 2025. That’s a staggering wave of cost that manufacturers had to absorb or pass on, and most of them did both.
Consumer Awareness: Most Americans Noticed, and Many Fought Back

Roughly three-quarters of Americans have noticed shrinkflation at their grocery store, and among them, nearly half, or 48%, have abandoned a brand due to shrinkflation. That’s a significant behavioral shift. When people feel deceived, they vote with their wallets.
The largest percentage of consumers who noticed shrinkflation, about 36%, said they were likely to switch to another brand, while a still-noteworthy 16% reported they would stop purchasing an impacted product altogether. Ultimately, quality is what the majority of Americans say has made them loyal to a brand, so those who prioritize quality are the most likely to stop buying an item entirely if it gets hit by shrinkflation.
Breakfast items have downsized roughly 10% recently, with family-size Frosted Flakes going from 24 ounces to 21.7, leading to a per-ounce price increase of close to 40%. That’s not a candy bar, but it illustrates just how pervasive the practice has become across the entire grocery store, not just the confectionery aisle.
Political Theater: When the Government Finally Noticed Shrinkflation
Shrinkflation eventually became too visible to ignore politically. In the United States, Democratic senators proposed the “Shrinkflation Prevention Act,” and President Biden addressed the issue in his March 2024 State of the Union speech. It was a rare moment where a candy bar essentially made it onto the political stage.
In 2024, a bill was introduced in the U.S. Senate which would ban shrinkflation. A separate bill, introduced in the U.S. House of Representatives, would require brands to label products that contain less product than before at the same price. Whether either bill gains real momentum is another story entirely. France enacted a law in 2024 requiring retailers to warn consumers about shrinkflation practices.
However, the data isn’t entirely as dramatic as the politics suggested. The U.S. Government Accountability Office’s analysis of 2019 to 2024 Bureau of Labor Statistics data found that downsizing accounted for less than one-tenth of a percentage point of the 34.5% increase in overall consumer prices during this period. So while the phenomenon is absolutely real and felt personally by millions, its macroeconomic footprint is smaller than the headlines implied.
The 2025 and 2026 Outlook: Is There Any Relief Coming?
Cocoa prices have eased from the record highs of late 2024, but a knock-on effect is still being passed through from chocolatiers onto consumers according to analysts. Poor weather and lower West African production pushed up cocoa futures, but supply is starting to increase again and could bring some relief to chocolate-lovers by next Easter.
Futures slid back towards $3,000 per tonne in early 2026, roughly 70% below the highs of 2024. That sounds encouraging. However, reformulation, smaller pack sizes and tighter price points introduced during the price spike are proving stickier than many manufacturers initially suggested. Despite lower futures, farmer income pressure, regulatory costs and hedging cycles mean chocolate prices aren’t automatically heading back down.
Some major brands reduced product sizes by over 30% in 2025 without reducing prices, with shrinkflation averaging around 14.8% among selected national grocery brands. In other words, even if the cocoa market calms down, the smaller bar you’re holding in 2026 is probably not going to get bigger again. The grams lost tend to stay lost.
What Can Consumers Actually Do About It?

There is, honestly, no perfect solution. But awareness is a powerful starting point. Downsizing is not typically disclosed on packaging, and consumers may not remember unit prices or notice small changes in sizes. The best defense is comparing unit prices, that is, the price per ounce or per gram, rather than the sticker price alone.
A typical family purchasing 20 affected products monthly may receive 8 to 12% less product volume for the same expenditure compared to the previous year’s purchases. Across an entire year of grocery shopping, that adds up to a meaningful financial hit. Digital tools, including shopping apps, can track price-per-unit history and alert consumers to significant changes. Some applications store historical pricing data, enabling comparison across multiple shopping trips.
Edgar Dworsky, a longtime consumer advocate and lawyer, has recorded shrinkflation on his website Consumer World since 1995. That’s the same year our candy bar index begins. The fact that someone has been documenting this for thirty years tells you everything about how persistent and systematic it truly is. Switching to store brands, buying in bulk when unit prices are favorable, and simply reading the net weight on packaging are the most practical tools shoppers have. They’re unsexy solutions. They work.
Conclusion: The Candy Bar Never Lies

The candy bar is a surprisingly accurate mirror of the American economy. It reflects raw material costs, supply chain fragility, corporate pricing strategy, consumer psychology, and the slow, persistent erosion of what a dollar buys. Since 1995, the combination of real price increases and quiet size reductions means that your dollar at a candy counter now buys you considerably less actual chocolate than it used to, even when the price tag looks familiar.
Cadbury Mini Eggs shrank from 10 ounces to 9 ounces in 2022 with no price change, and that kind of change is happening across hundreds of products simultaneously. The shrinkflation story isn’t just about candy. It’s about the slow, persistent way value gets extracted from everyday life, one gram at a time, in the quietest possible way. Next time you unwrap a candy bar, take a second look at the weight on the wrapper. You might be surprised by what you find – or more accurately, by what’s missing.
What do you think? Have you noticed your favorite candy bars getting smaller over the years? Share your experience in the comments.